
You just migrated a legacy Spring Boot app. New Boot version, new Java version, maybe a jump from javax to jakarta. The app starts, tests pass, and now someone asks the question that matters: is it actually behaving the same in production?
Without telemetry, you’re guessing. With it, you can put p99 latency before and after the migration side by side and answer with data. That’s the real reason to wire up observability during a modernization, not after.
The tooling question used to be messy. Sleuth for traces, Zipkin for storage, Micrometer for metrics, something else for logs, and every vendor with its own agent. That era is over. OpenTelemetry won. Traces, metrics, and logs in one vendor-neutral standard, and Spring Boot 3 supports it natively.
The catch is there are two ways to wire it up, and most guides don’t tell you when to pick which. This one does.
Both paths run in a companion repo: spring-boot-otel-demo. Two Spring Boot services producing one distributed trace, plus a full local stack (OpenTelemetry Collector, Grafana Tempo, Prometheus, Grafana) behind Docker Compose profiles, one profile per integration path.
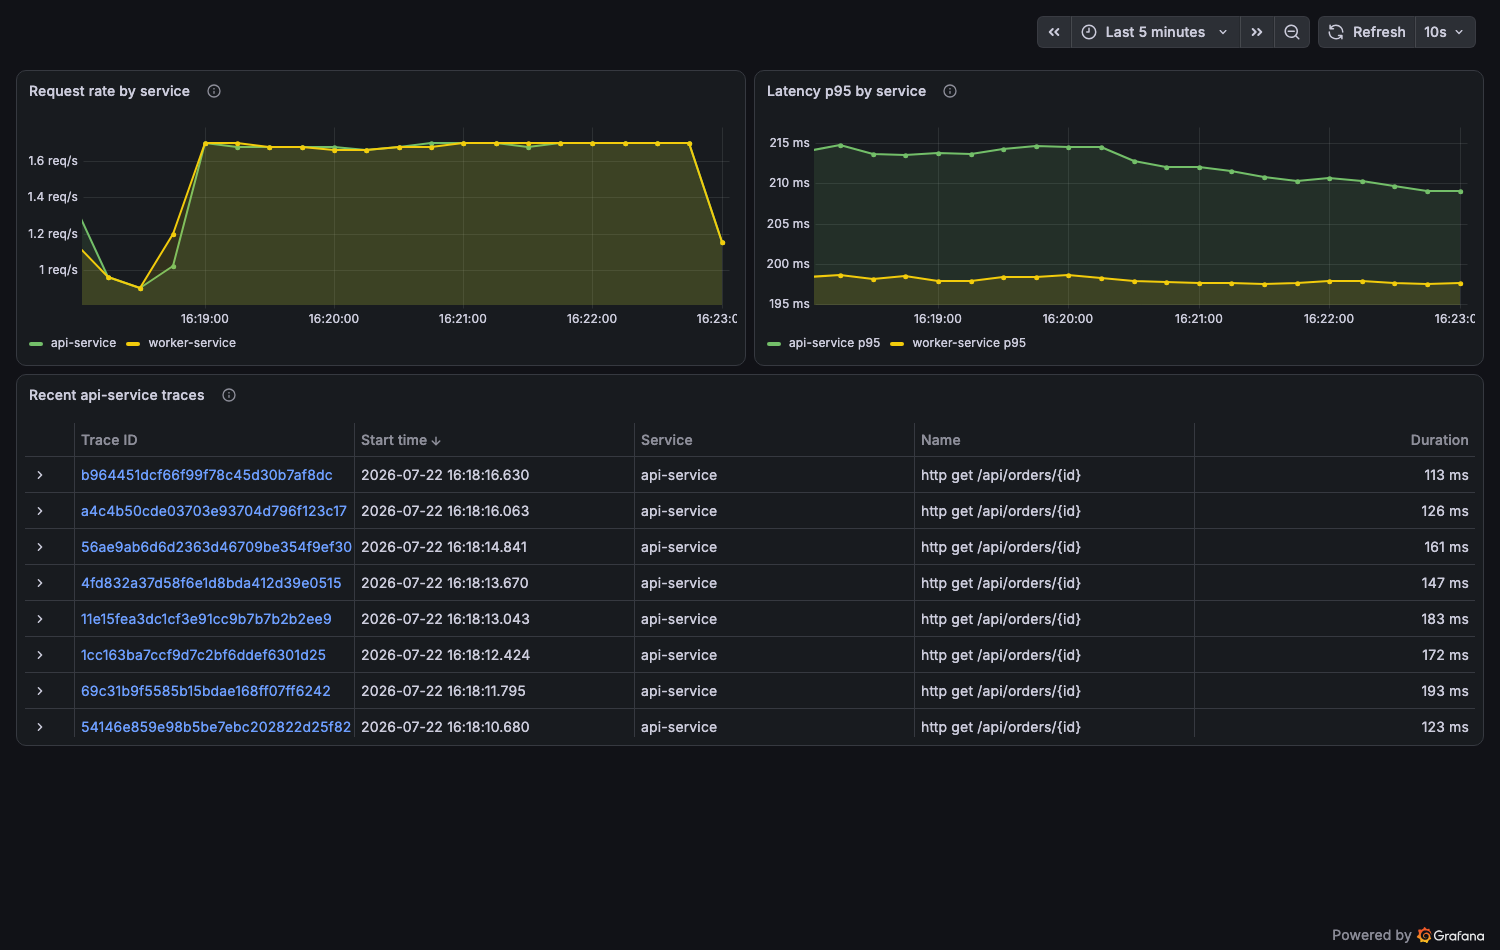
Here’s what you get after docker compose up and a few minutes of traffic. Request rate and p95 latency per service, plus recent traces. Notice api-service’s p95 sitting just above worker-service’s: that’s the cost of wrapping a downstream call, visible at a glance.
Why OpenTelemetry, and What Happened to Sleuth
Spring Cloud Sleuth is dead. It ended with the Spring Boot 2.x line. The tracing internals moved into Micrometer Tracing, which ships as a core part of the Spring observability stack in Boot 3 and later. If you’re reading a tutorial that adds spring-cloud-starter-sleuth, close the tab.
OpenTelemetry (OTel) is the CNCF standard that replaced the old fragmented landscape. It gives you three things:
- A wire protocol (OTLP) that every serious backend accepts: Grafana Tempo, Jaeger, Datadog, Honeycomb, New Relic, Elastic, all of them.
- A data model for traces, metrics, and logs that carries the same resource attributes, so you can correlate across all three.
- Vendor neutrality. You instrument once and point the export wherever you want. Switching backends is a config change, not a re-instrumentation project.
For a modernization, that last point is the argument. Instrumenting a legacy app is real work. Doing it against a standard means you never do it twice.
The Two Integration Paths
There are two legitimate ways to get OTel data out of a Spring Boot app. They produce compatible output but sit in different places.
Path 1: Micrometer Tracing + OTLP export. Spring Boot’s built-in observability. Micrometer instruments your app, the OTel bridge translates to OTel’s format, and Boot’s management.otlp.* properties handle export. Everything lives in your build and config.
Path 2: The OpenTelemetry Java agent. A -javaagent JAR that instruments bytecode at startup. Zero code changes, zero build changes. There’s also the opentelemetry-spring-boot-starter from the OTel project, which gives you most of the agent’s instrumentation as a normal dependency instead of an agent.
Here’s how they compare:
| Micrometer Tracing + OTLP | OTel Java Agent | |
|---|---|---|
| Code changes | Dependencies + properties | None |
| Deployment changes | None | Add -javaagent flag |
| Custom spans | Observation API, @Observed | OTel SDK annotations or manual API |
| Library coverage | Spring portfolio + common clients | Very broad (hundreds of libraries) |
| Default sampling | 10% | 100% |
| Config lives in | application.yml | Env vars / system properties |
| Owned by | The dev team | Often the ops/platform team |
| Overhead | Low | Low, slightly higher startup cost |
My rule of thumb: if you own the code and want observability to be part of it, use Micrometer Tracing. If you’re instrumenting a service you can’t or won’t modify, or your platform team standardizes on the agent across languages, use the agent. Don’t run both against the same signals. You’ll get duplicate spans.
Path 1: Micrometer Tracing with OTLP Export
This is the setup I default to for Spring Boot apps we’re actively working on.
Dependencies
<dependencies>
    <!-- Actuator brings in the observability plumbing -->
    <dependency>
        <groupId>org.springframework.boot</groupId>
        <artifactId>spring-boot-starter-actuator</artifactId>
    </dependency>

    <!-- Bridges Micrometer's tracing API to the OpenTelemetry SDK -->
    <dependency>
        <groupId>io.micrometer</groupId>
        <artifactId>micrometer-tracing-bridge-otel</artifactId>
    </dependency>

    <!-- Exports traces over OTLP -->
    <dependency>
        <groupId>io.opentelemetry</groupId>
        <artifactId>opentelemetry-exporter-otlp</artifactId>
    </dependency>

    <!-- Exports metrics over OTLP (skip if you scrape with Prometheus) -->
    <dependency>
        <groupId>io.micrometer</groupId>
        <artifactId>micrometer-registry-otlp</artifactId>
    </dependency>
</dependencies>
Spring Boot manages the versions for all four. No version numbers needed.
One note on metrics: if you already scrape /actuator/prometheus, keep doing that. OTLP metrics export is for when you want everything flowing through the OTel Collector. Both work. Pick one, not both, for the same metrics.
Configuration
spring:
  application:
    name: order-service   # becomes service.name on every span and metric

management:
  otlp:
    tracing:
      endpoint: http://localhost:4318/v1/traces
    metrics:
      export:
        url: http://localhost:4318/v1/metrics
        step: 30s
  tracing:
    sampling:
      probability: 1.0    # default is 0.1 -- see pitfalls below
That’s the whole setup. Boot auto-configures the OTel SDK, wires the exporter, and instruments incoming HTTP requests, RestTemplate, RestClient, WebClient, and most of the Spring portfolio through the Observation API.
The endpoint here is an OTel Collector, not your backend directly. More on that next.
On Spring Boot 4, this collapses to one starter
The dependencies and property names above are the Spring Boot 3 wiring, and they are what you will meet in most codebases today. Spring Boot 4 ships a first-party spring-boot-starter-opentelemetry that replaces all four dependencies with one, and it renames the tracing export properties. The mapping:
| Spring Boot 3 | Spring Boot 4 |
|---|---|
spring-boot-starter-actuator + micrometer-tracing-bridge-otel + opentelemetry-exporter-otlp + micrometer-registry-otlp | spring-boot-starter-opentelemetry |
management.otlp.tracing.endpoint | management.opentelemetry.tracing.export.otlp.endpoint |
management.otlp.metrics.export.url | unchanged |
management.tracing.sampling.probability | unchanged |
The old management.otlp.tracing.* keys are deprecated in Boot 4 and no longer take effect, so this rename is not optional when you upgrade. Everything else in this article, the Observation API, context propagation, log correlation, and the pitfalls, works identically on both versions.
Wiring in the OTel Collector
You can export straight to a backend, but don’t. Put a Collector in between. It batches, retries, redacts, and lets you change backends without touching a single application. It’s the difference between “reconfigure 15 services” and “edit one YAML file”.
A minimal Collector config that receives OTLP and forwards traces and metrics:
receivers:
  otlp:
    protocols:
      grpc:
        endpoint: 0.0.0.0:4317
      http:
        endpoint: 0.0.0.0:4318

processors:
  memory_limiter:
    check_interval: 1s
    limit_mib: 512
  batch:
    timeout: 5s

exporters:
  otlphttp:
    endpoint: https://your-tracing-backend.example.com
  debug:
    verbosity: basic    # handy while setting up, remove later

service:
  pipelines:
    traces:
      receivers: [otlp]
      processors: [memory_limiter, batch]
      exporters: [otlphttp, debug]
    metrics:
      receivers: [otlp]
      processors: [memory_limiter, batch]
      exporters: [otlphttp]
Run it locally with Docker while you’re developing:
docker run --rm -p 4317:4317 -p 4318:4318 \
  -v $(pwd)/otel-collector.yml:/etc/otelcol-contrib/config.yaml \
  otel/opentelemetry-collector-contrib
Start your app, hit an endpoint, and you should see spans in the Collector’s debug output within seconds. If you see nothing, check sampling first. It’s always sampling.
Custom Spans with @Observed and the Observation API
Auto-instrumentation gives you the HTTP layer. The spans you actually want in an incident are the business ones: “how long did the pricing calculation take”, “which tenant was this”. That’s what the Observation API is for.
The annotation route needs AOP and one bean:
@Configuration
public class ObservabilityConfig {

    @Bean
    ObservedAspect observedAspect(ObservationRegistry registry) {
        return new ObservedAspect(registry);
    }
}
Then annotate the methods that matter:
@RestController
@RequestMapping("/orders")
public class OrderController {

    private final OrderService orderService;
    private final ObservationRegistry registry;

    public OrderController(OrderService orderService, ObservationRegistry registry) {
        this.orderService = orderService;
        this.registry = registry;
    }

    @GetMapping("/{id}")
    @Observed(name = "order.lookup", contextualName = "order-lookup")
    public Order getOrder(@PathVariable Long id) {
        return orderService.findById(id);
    }

    @PostMapping
    public Order create(@RequestBody OrderRequest request) {
        // Programmatic version: more control, no AOP required
        return Observation.createNotStarted("order.create", registry)
            .lowCardinalityKeyValue("order.type", request.type())   // safe as a metric tag
            .highCardinalityKeyValue("order.id", request.id())      // trace-only, never a metric tag
            .observe(() -> orderService.create(request));
    }
}
One Observation produces both a span and a timer metric. That’s the point of the API: you instrument once and get traces and metrics from the same call site.
The low/high cardinality split matters. Low-cardinality key-values become metric tags. High-cardinality ones only go on the span. Get this wrong and you’ll melt your metrics backend, which brings us to pitfalls shortly.
Trace Context Propagation Across Services
Distributed tracing only works if the trace context travels with the request. The standard is W3C Trace Context: a traceparent header carrying the trace ID, parent span ID, and sampling decision.
traceparent: 00-4bf92f3577b34da6a3ce929d0e0e4736-00f067aa0ba902b7-01With Micrometer Tracing, propagation is automatic as long as your HTTP clients come from Spring’s builders. RestClient.Builder, RestTemplateBuilder, and WebClient.Builder are all instrumented. The receiving service, if it’s also instrumented, continues the same trace.
The classic mistake: new RestTemplate(). A hand-constructed client bypasses the instrumentation entirely, the header never gets attached, and every downstream call starts a fresh disconnected trace. Always inject the builder.
Kafka and other messaging paths propagate context through message headers, and the common brokers are covered. Verify it, though. A trace that silently breaks at the queue boundary looks exactly like a working setup until you need it.
Correlating Logs with traceId and spanId
Traces tell you where the time went. Logs tell you what the code was thinking. The join key is the trace ID, and Micrometer Tracing puts traceId and spanId into the logging MDC on every request thread.
Spring Boot appends a correlation block to its default console pattern automatically when tracing is on. If you run a custom logback pattern, add the MDC fields yourself:
<configuration>
    <appender name="CONSOLE" class="ch.qos.logback.core.ConsoleAppender">
        <encoder>
            <pattern>%d{HH:mm:ss.SSS} [%thread] %-5level [%mdc{traceId:-},%mdc{spanId:-}] %logger{36} - %msg%n</pattern>
        </encoder>
    </appender>

    <root level="INFO">
        <appender-ref ref="CONSOLE"/>
    </root>
</configuration>
Now a slow span in your tracing UI gives you a trace ID, and that trace ID greps straight to the log lines from that exact request. During a migration bake-off this is the workflow: find the regressed trace, jump to its logs, find the cause. Without correlation you’re diffing haystacks.
If you ship JSON logs, structured logging output includes the MDC fields, so traceId becomes a queryable field in your log backend for free.
Path 2: The OpenTelemetry Java Agent
Sometimes you can’t touch the build. Legacy service, frozen release, or a platform team that instruments every JVM the same way. That’s what the agent is for.
java -javaagent:opentelemetry-javaagent.jar \
     -Dotel.service.name=order-service \
     -Dotel.exporter.otlp.endpoint=http://localhost:4318 \
     -jar order-service.jar
Or with environment variables, which is what you’d do in Kubernetes:
export OTEL_SERVICE_NAME=order-service
export OTEL_EXPORTER_OTLP_ENDPOINT=http://otel-collector:4318
java -javaagent:opentelemetry-javaagent.jar -jar order-service.jar
The agent rewrites bytecode at class-load time and instruments an enormous list of libraries: Spring MVC, JDBC, Kafka, gRPC, Redis clients, and a few hundred more. Traces, metrics, and logs, all over OTLP, zero code changes. For getting baseline telemetry out of an app nobody wants to open, it’s hard to beat.
The middle option is the opentelemetry-spring-boot-starter from the OTel project. It packages much of the agent’s instrumentation as a regular dependency, no -javaagent flag. It’s the right pick for GraalVM native images, where agents don’t work, or when the startup cost of bytecode weaving bothers you.
Just don’t stack the agent on top of Micrometer’s OTLP export. Pick one owner for each signal.
Common Pitfalls
Sampling defaults will surprise you in one direction or the other
Micrometer Tracing samples 10 percent of traces by default. Teams set everything up, make five test requests, see zero traces, and conclude the setup is broken. It’s management.tracing.sampling.probability: 0.1 doing its job. Set it to 1.0 in dev and staging.
The agent has the opposite default: it samples everything. Turn that on for a high-traffic service and you’ll notice the export volume on your backend bill. Decide your production sampling rate on purpose, in both setups.
High-cardinality metric tags
Every unique tag value combination creates a new time series. Tag a metric with userId or orderId and you’ve created a series per user. Your metrics backend will either fall over or charge you for the privilege.
The Observation API’s split exists exactly for this: lowCardinalityKeyValue for things like status, type, or region; highCardinalityKeyValue for IDs. IDs belong on spans, where a unique value per request is the whole point.
Context doesn’t cross @Async or custom executors by itself
Trace context lives in a ThreadLocal. Hand work to another thread and the context stays behind. The @Async method runs, but its spans are orphaned and its logs have no trace ID.
The fix in Spring Boot is a task decorator:
@Configuration
public class AsyncConfig {

    @Bean
    ThreadPoolTaskExecutor taskExecutor() {
        ThreadPoolTaskExecutor executor = new ThreadPoolTaskExecutor();
        executor.setTaskDecorator(new ContextPropagatingTaskDecorator());
        return executor;
    }
}
ContextPropagatingTaskDecorator ships in Spring Framework 6 and uses Micrometer’s context-propagation library to carry the trace context onto the worker thread. Any custom ExecutorService you build yourself needs the same treatment. If your traces keep dead-ending right where the code goes async, this is why.
Hand-built HTTP clients
Worth repeating: new RestTemplate() and WebClient.create() are not instrumented. Inject the builders. This one line of review feedback fixes more broken traces than anything else.
The Modernization Angle
If you’re mid-migration, the sequencing matters: instrument before you cut over, not after.
Run the old version with telemetry for a week. Now you have a baseline: latency percentiles per endpoint, error rates, throughput. Migrate, and run the same dashboards against the new version. The conversation stops being “it seems fine” and becomes “p99 on checkout went from 480ms to 210ms and the error rate is flat”.
That’s how you prove a migration didn’t regress anything. It’s also how you catch the one endpoint that did regress before your users do.
When to Get Help
For a single Spring Boot service, this setup is a day of work: dependencies, properties, a Collector, and a dashboard. Do it yourself, you’ll be fine.
It gets harder when there’s a fleet. Fifteen services on three different Boot versions, some still on 2.x where none of this applies, context breaking at queue boundaries, a metrics bill climbing from cardinality nobody’s audited, and a migration deadline on top. Standardizing observability across that takes experience with both the OTel stack and the migration path itself.
We do this work regularly. If you’re modernizing Spring Boot services and want observability that proves the migration worked, reach out and we can walk through your specific situation.
Related Articles
- Spring Boot Monitoring with Actuator and Prometheus — The metrics-first setup, and where Prometheus scraping still makes sense.
- Spring Boot Logging Best Practices — Structured logging patterns that pair with trace correlation.
- Spring Boot Microservices Architecture Patterns — The architecture context where distributed tracing earns its keep.
- Spring Boot Consulting — How we help teams with Spring Boot upgrades, migrations, and production readiness.
Frequently Asked Questions
Do I still need Spring Cloud Sleuth for tracing in Spring Boot?
No. Spring Cloud Sleuth is dead. It reached end of life with the Spring Boot 2.x line and was replaced by Micrometer Tracing in Spring Boot 3. If your migration guide mentions Sleuth, it’s outdated. The modern setup is Micrometer Tracing with the OpenTelemetry bridge, or the OpenTelemetry Java agent.
Should I use the OpenTelemetry Java agent or Micrometer Tracing with Spring Boot?
Use Micrometer Tracing when you want observability config in your application code, custom spans via the Observation API, and no deployment changes. Use the Java agent when you can’t touch the code, need broad library coverage out of the box, or the ops team owns observability. Both export OTLP, so you can switch later without changing your backend.
Why are most of my traces missing in Spring Boot?
Almost always sampling. Spring Boot’s Micrometer Tracing defaults to sampling 10 percent of traces, so 9 out of 10 requests never produce a trace. Set management.tracing.sampling.probability to 1.0 in lower environments and pick a deliberate rate for production. The OpenTelemetry Java agent samples everything by default, which is the opposite surprise.
How do I get traceId and spanId into my Spring Boot logs?
With Micrometer Tracing on the classpath, Spring Boot puts traceId and spanId into the logging MDC automatically and appends a correlation block to the default console pattern. If you have a custom logback pattern, add %mdc{traceId} and %mdc{spanId} to it explicitly. Once they’re in every log line, you can jump from a slow trace straight to its logs.
Java Modernization Readiness Assessment
15 questions your team should answer before starting a migration. Takes 10 minutes. Could save you months.